
How it works:
Effortlessly create, manage, and display digital signage with our platform. All you need to get started is the right hardware, an internet connection, and a ScreenCloud account.
1. Hardware
Hardware OptionsRemote Device ManagementScreenCloud OSPlayers Download2. Software
Studio CMSApps & IntegrationsCanvasSecurityDashboardsDeveloper3. Support & Services
Enterprise: CommunicateProfessional ServicesSupport & Customer SuccessPlaybooks
8 Different Types of Dashboards Using Geckoboard
We give you inspiration aplenty with these different dashboards made possible by our buddies at Geckoboard.

You don’t need us to tell you how important it is that your team have a finger on the metrics of your company. Giving people information makes them feel empowered and empowering your sales, marketing or customer service team? That’s a great big tick in helping them to get more stuff done and get better at doing it.
Enter your digital signage dashboard. We’ve waxed lyrical about why you should use dashboards and what you might put on them. But truth is, if it’s not simple to take your info, turn it into something that looks nice and get it up on the wall, it’s just not going to happen.
Enter our buddies at Geckoboard. We’ve been having a play around with their dashboard system in the ScreenCloud office, a competition if you will, of who can make the best dashboard. So we thought we’d share with you some of the dashboards we’ve created easily using different systems and the ScreenCloud Geckoboard app.
1. Sales performance dashboard
Sales are pretty integral to any business and when you take that data and place it on a screen, it becomes much more noticeable. We know that in the ScreenCloud office, each time we’re close to hitting a MRR milestone, it gives everyone a little energy boost to help get it over the line. If that info wasn’t up on the wall where we could all see it, it’d be much easier to just roll from one milestone to the other without even noticing.
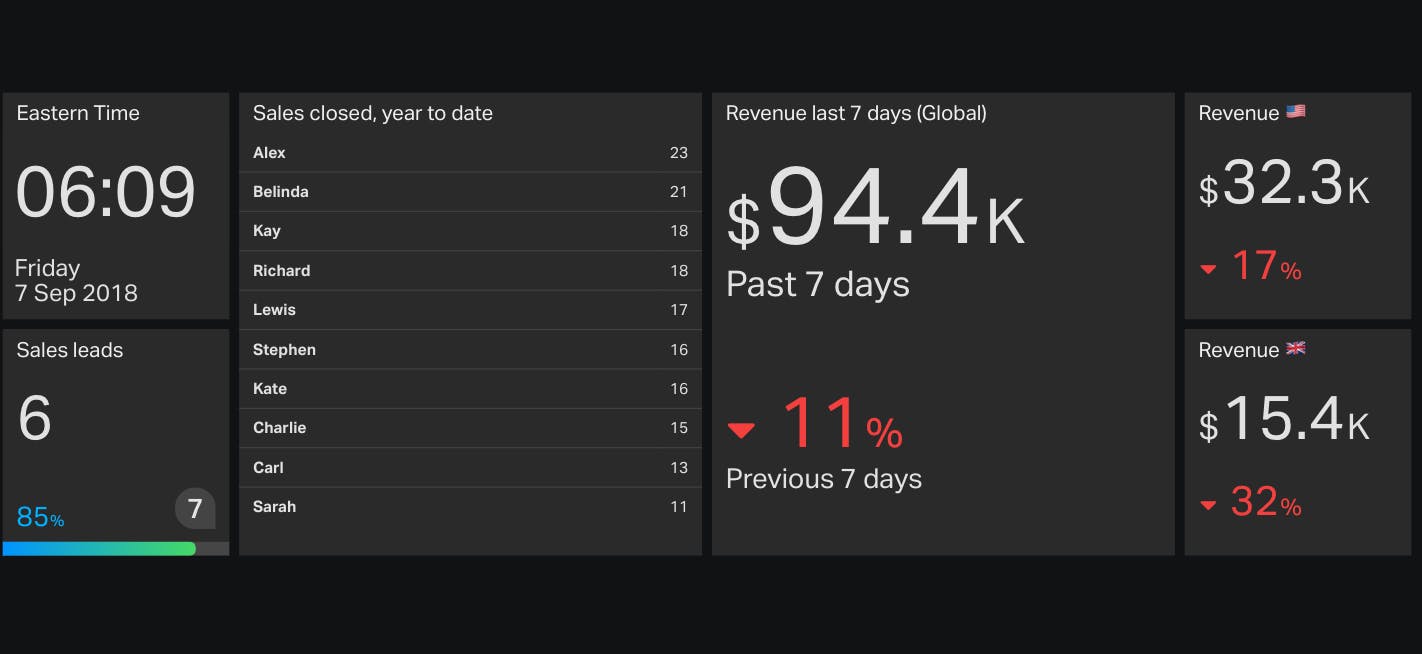
If you use sale tools like Salesforce or Pipedrive, or accounting systems like Recurly or Freshbooks, Geckoboard already has the integrations set up for you to plug into your sales data easily.
2. Customer support dashboard
Here’s one we made earlier, our ScreenCloud customer support dashboard:
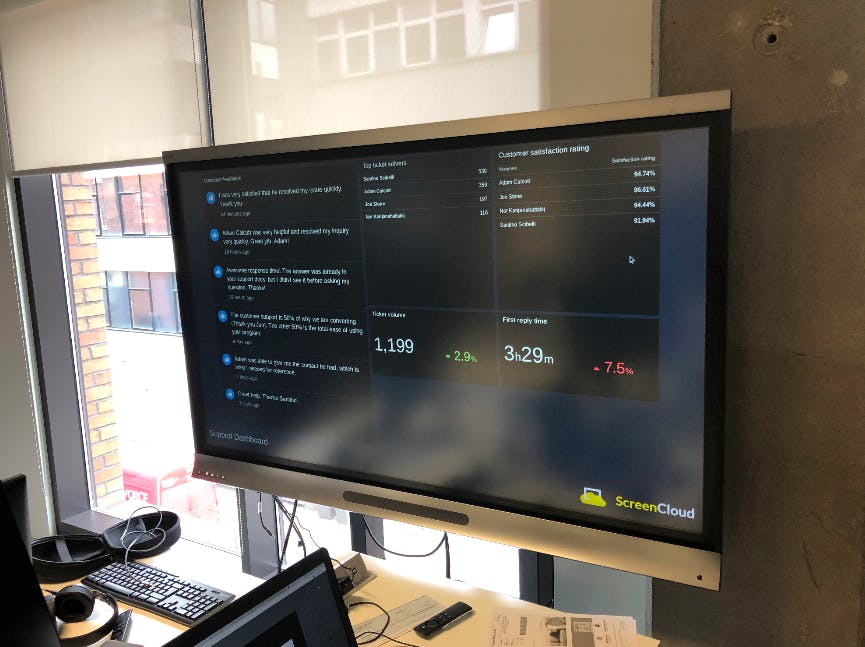
If customer support is important to your organization like it is to us, they’ll be plenty of support metrics you can track and put on your dashboard to monitor success. For example, a changing CSAT (Customer Satisfaction Score) might show a dip in customer service, or even flag a product problem which is causing dissatisfaction. You can also monitor your response time - and try beating it to bring down your average. We integrate our Geckoboard dashboard with Zendesk to provide pretty much everything we need to see.
3. Social media dashboard
The big benefit of a social media dashboard is that you can combine metrics on followers alongside the latest tweets or direct messages. Integrating channels like Facebook, Instagram and Twitter is simple to do and really effective at showing any dips or areas you want to improve on.
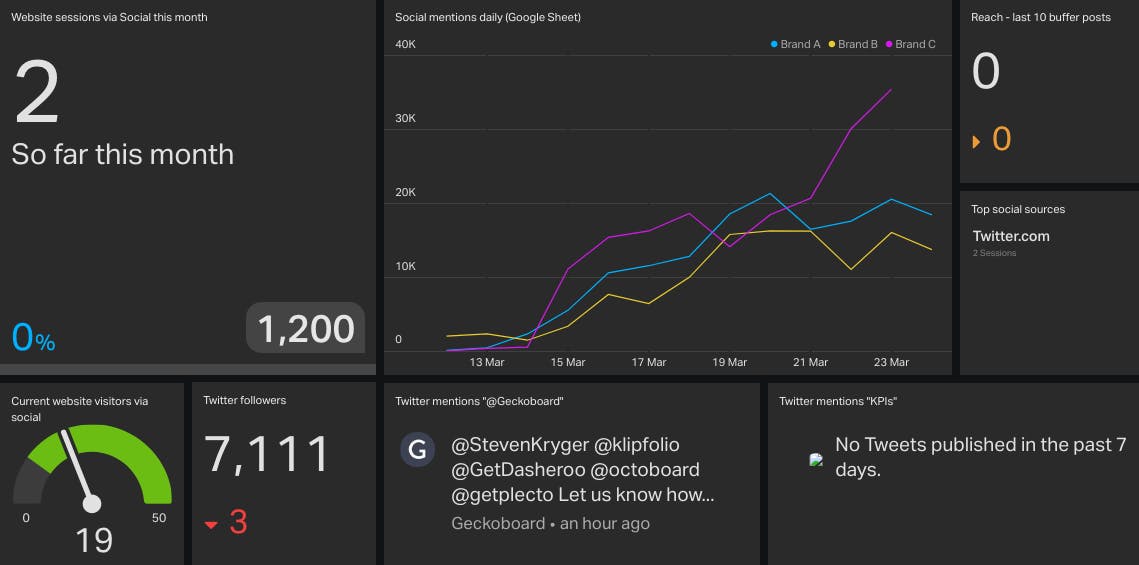
This dashboard is an example given by Geckoboard but in a real business scenario, we’d be considering why the low reach on scheduled posts is happening and how to increase the number of website sessions by using social media to divert traffic. When these figures are locked away in systems, they’re much less likely to get flagged.
4. Office metrics
For the energy-concerned, office dashboards are a great way to show real time office metrics like how much power is being used or even how many people are in the building at one time. Smart offices are becoming big business and if you’re already on board with smart meters for your energy usage, or readers that track who’s in the building, it’s not actually that difficult to show these stats on screen.
Check out this guide for low-budget ways to make your office more connected.
5. Website analytics
Perhaps the most universal type of dashboard is website analytics. By hooking up Geckoboard and your Google Analytics account you can see a day-by-day view of what’s going on throughout your website and information such as the channels that are referring the most traffic.
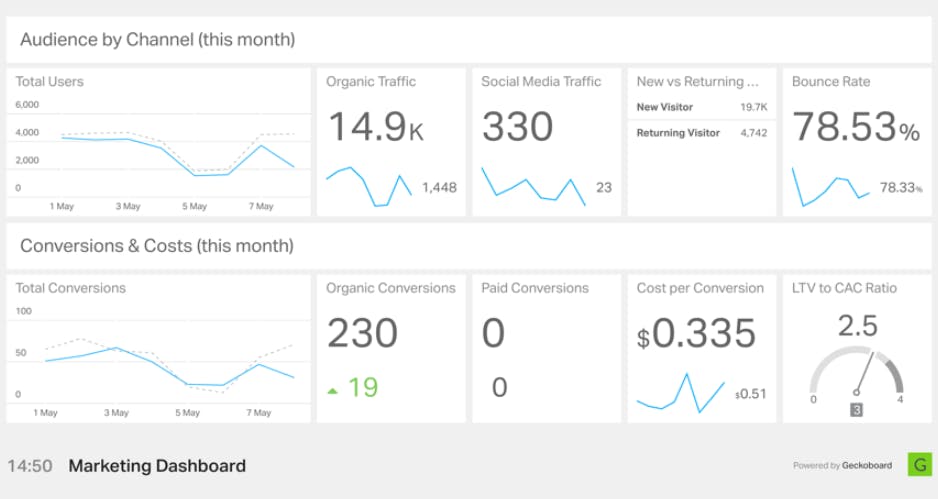
We’ve seen this used in a real office of a real estate company and it was clear just how tuned in the team were at getting more traffic to the site. It also means that if your website gets a sudden boost, you know about it before the phones start to ring. Similarly, if your traffic suddenly hits zero it could indicate your website’s down, long before you’d usually realize.
6. Comparative dashboard
There are plenty of general dashboards which work for most organizations but there’s also some which are instinctively made for certain industries. For example, a comparative dashboard of results between department or even across school district or group would be great in education. This is also a good reminder that your dashboards can be public-facing but that they don’t have to be. A comparative dashboard of schools within the state would be a useful addition to any staff room but would be far too intimidating to put up in hall corridors.
Top hint: If you want to share information to your screen, but not make it available publicly, you can do this with ScreenCloud and Geckoboard by using their pairing code for secure dashboards.
7. Gamification dashboard or leaderboard
There’s nothing quite like a leaderboard dashboard to get people looking up! Think of any office incentives you run like a Fitbit challenge, a baking competition or a “best Instagram of the week”.
The great thing about these dashboards is that they’re not limited to one department or even the best performers. Anyone can get involved with a company incentive and the more creative you get, the more it evens the score across the board.
For more help designing your perfect leaderboard dashboard, check out this post.
8. Financial dashboard
In any company, the finances impact everybody in that business. Yet often, they’re not seen or understood by anyone other than the Finance Manager. Dashboards that share information like burn rate and the length of the cash runway help build momentum and a sense of provocation; if we don’t do X here’s exactly what’s going to happen.
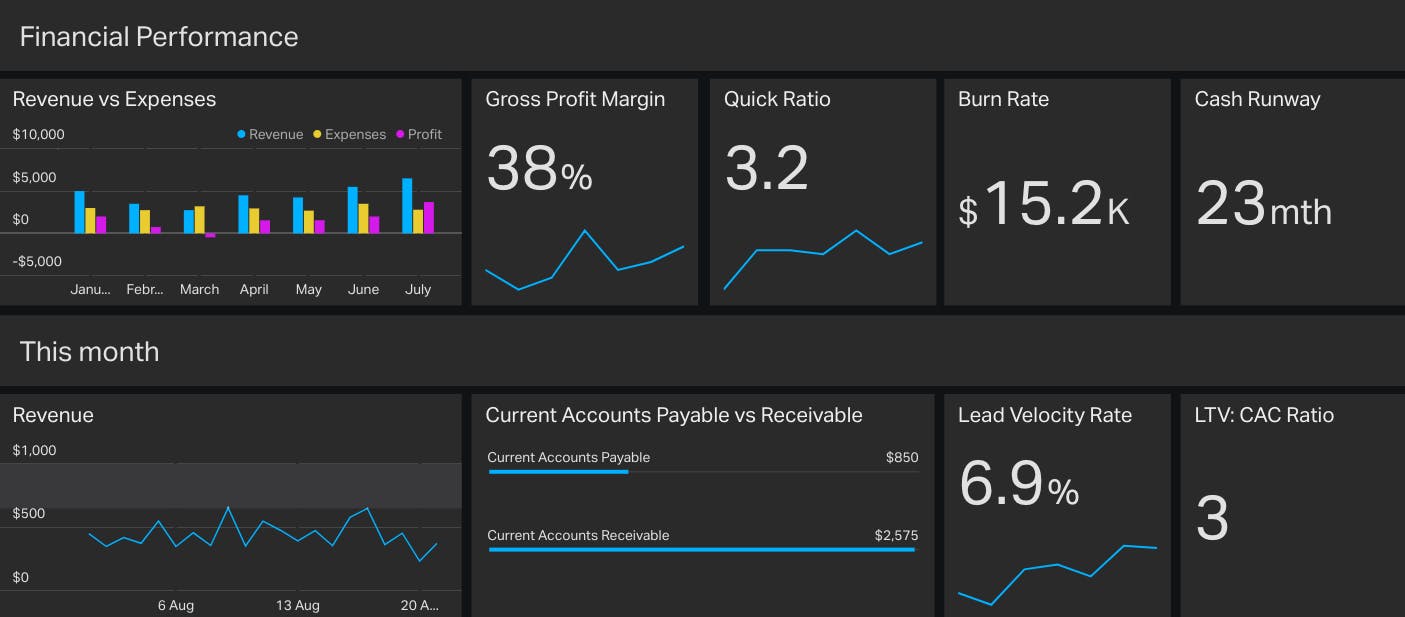
Of course some of these metrics are only relevant to an early stage company but a financial dashboard can be used to display the metrics that matter most to you. This might be invoices due, year-on-year turnover or profit margin.
Ready to get started with your very own dashboard? Follow our lead and grab a Geckoboard account to use with the Geckoboard app on ScreenCloud. Simple and effective!

Ready to get your organization connected?
Connect your first screen today with our 14-day free trial